Do listed businesses in the US have a different risk profile to other companies around the world, or do they face many of the same risks? While there are commonalities between markets, our analysis of the risk data shared in annual reports by S&P 500 companies, compared to the FTSE 100, indicated that there is also significant deviation.
Through data available in our AI-powered Risk Reporting Comparison Tool, we're able to analyse every principal/material risk that has been mentioned in a company annual report in 2023, as of September, for S&P 500 and FTSE 100 organisations.
Please note that many other organisations are included in the tool, but this article focuses on these two listings.
Divergence in high level "Level 1" risks reported in 2023
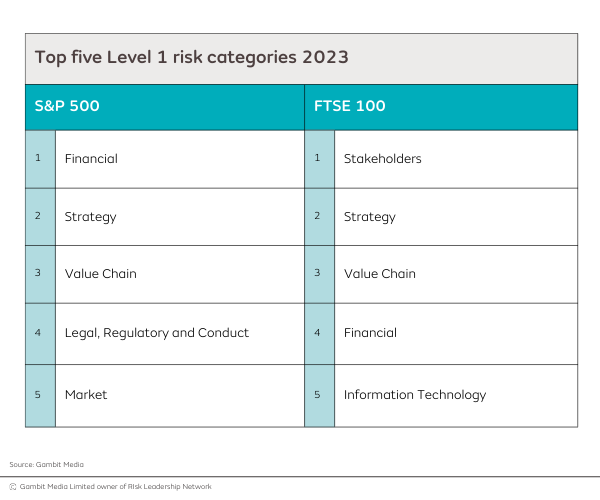
Level 1 risks
To analyse the risks companies include in their annual report, we use a three-tier taxonomy. The above table focuses on Level 1 risks - the highest level risk category. These are intentionally broad to encompass many different types of risks. Our analysis, and all the data in the Risk Reporting Comparison Tool, goes on to break those risks down further through the subcategories at Level 2 and Level 3, as well as allowing users to search and filter down to specific risks too.
Bigger focus on financial risks for US companies
Financial risks topped the S&P 500 ranking of Level 1 risks. In fact, 2,892 Financial risks have been reported in 2023 so far by the 500 companies listed on the S&P. Financial risk accounts for 21% of the total risks these organisations reported, compared to just 12% of the risks reported by FTSE 100 organisations in the same period.
|
Level 2 risks e.g. Level 1: Value Chain; Level 2: Products; Level 3: Product Safety and Quality. The taxonomy was developed with input from members and risk leaders across our wider network. |
The chart below shows how the 2,892 Financial risks (Level 1) reported by S&P 500 companies so far this year are broken down into Level 2 risks:
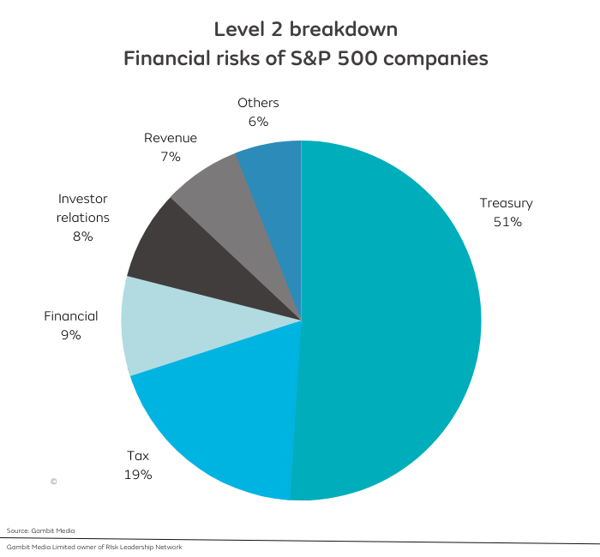
By drilling further into our data in the Risk Reporting Comparison Tool, we can see which specific Treasury risks S&P 500 companies are reporting. Most commonly, these are changes in credit rating that could adversely affect a company's financial health, and fluctuations in interest rates.
There are some parallels - although Financial risks are further down the ranking (4th) for Level 1 risks at FTSE 100 companies, Treasury makes up 41% of those Financial risks reported at Level 2.
Do your own analysis in our Risk Reporting Comparison Tool
We created the Risk Reporting Comparison Tool as a response to a specific member priority, who needed to cut down the time they spent sense-checking their annual report against peers. This interactive database of the risk sections of company annual reports contains over 17k reported principal risks, that you can filter by sector, company or listing. The tool is available to all our members and is continually developed, each iteration in response to the needs of a member. We've got some slots coming up to show the tool to non-members - request a demo here. |
All eyes on common stocks for the S&P 500
Why are Financial risks so prominent for US businesses? We conducted a search in the Risk Reporting Comparison Tool of all principal risks mentioned by S&P 500 organisations on the keyword "common stock" in 2023 so far:
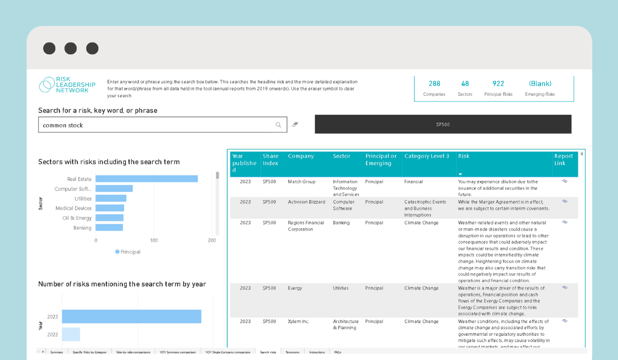
922 of the 13,053 principal risks reported by S&P 500 companies in 2023 so far refer to risks related to "common stock" - i.e., share price.
By contrast FTSE companies (and organisations in other markets, e.g., ASX 20) focus almost exclusively on risks to the business, while the impact of these risks on share price is less explicit in annual reporting. Performing the same search on FTSE 100 principal/material risks, there were no mentions of common stock, and just 5 principal risks in 2023 relating to the search term "share price".
Alignment between markets on Strategy and Value Chain
We saw above that S&P 500 and FTSE 100 organisations place, on average, the same degree of importance on risks related to Strategy and Value Chain. However, they focus on different risks within both categories. For example, Strategy:
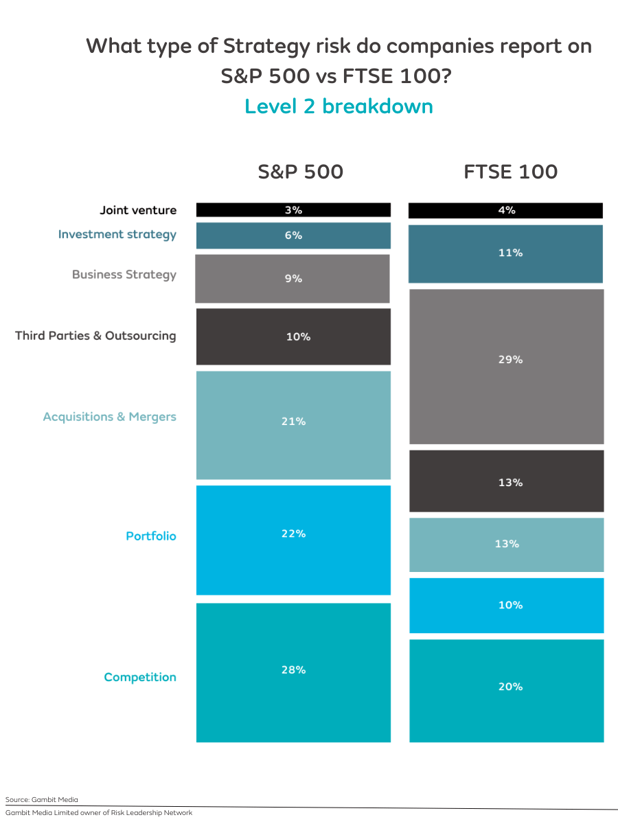
Whilst the average FTSE company is looking more inwards when it comes to Strategy risk, S&P 500 organisations, on average, appear to focus more on outward market considerations. Business Strategy accounts for 29% of Strategy risks among FTSE 100 companies - when we drill down into the details, they cite the organisation not delivering long-term growth, or a particular strategic investment not paying off, for example. Meanwhile, organisations on the S&P 500 are focusing on Competition (28% of Strategy risks), with many mentioning the highly competitive markets in which they operate.
Why is the spotlight on S&P 500 data?In response to a member priority, we added US data to the Risk Reporting Comparison Tool in September 2023. This data will be updated, using AI, as more annual reports are published. See the member case study:
|
Drilling down further: S&P 500 companies more interested in Legal & Regulatory risks
Regardless of their Level 1 categorisation, what trends can we see in the Level 2 risks reported by S&P 500 and FTSE 100 organisations?
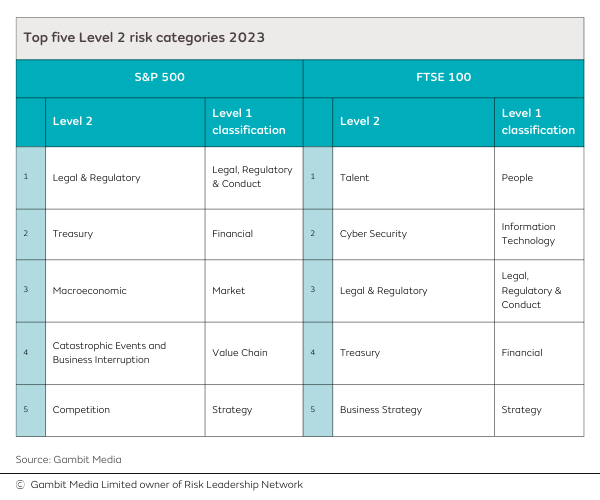
As with Level 1 risk categories, there is quite a lot of variation between the two lists; while Legal & Regulatory and Treasury appear on both lists, the other three Level 2 risks on each list are different, suggesting a deviation in focus between S&P 500 and FTSE 100 companies.
For example, while S&P 500 companies are mentioning Business Interruption risks (like a major failure of infrastructure) and Catastrophic Events (such as earthquakes and tornadoes) more often than FTSE 100 companies, the latter group of companies is placing more emphasis on Cyber Security risks, such as breaches of customer data and the failure of operations due to cyber-attack.
This is just a snapshot of the information that members can find in the Risk Reporting Comparison Tool. If you're preparing your annual risk report and want to analyse the risks other companies are reporting across a range of different sectors and listings, it's really worth requesting a short demo of the tool to see how it can significantly speed up the process for you.
Share this

Reporting risks in smarter ways - our Risk Reporting Comparison Tool

External risk reporting: 6 key trends from 2024