Companies are increasingly using key risk indicators (KRIs) to stay within risk appetite and better assess the threats and opportunities that may impact their ability to achieve objectives, but how can you get the maximum value out of these metrics?
If KRIs are a crucial component of a business’ risk appetite framework, this is because they demonstrate to senior leaders whether too much risk is being taken (or, indeed, not enough) across each of the organisation’s principal/material risk areas. A key component of any KRI, then, is setting the right upper and lower limits for risk-taking, which usually varies depending on the risk category.
For more about risk appetite, including definitions and advice from practising risk leaders on how they are setting and embedding risk appetite within the business, click here to read our full guide.
When determining risk appetite with senior leaders, there should be a consideration of what is operationally and strategically important to the business. While it may be easier for the risk team to filter up information to senior leaders about the operational risks and challenges the business is facing, the long-term, strategic outlook will be driven by the executive level of the organisation.
Aligning the bottom-up and top-down view of risk is therefore key to setting risk appetite for each of the business’ individual risk areas. To achieve this, some CROs run a session with board-level executives, while others speak with them individually, to find out what risks matter most to them and where they see the greatest opportunities.
This can then be mapped onto the information filtered up through the organisation via risk registers, allowing you to identify which risks need to be controlled more tightly and those for which there is greater appetite.
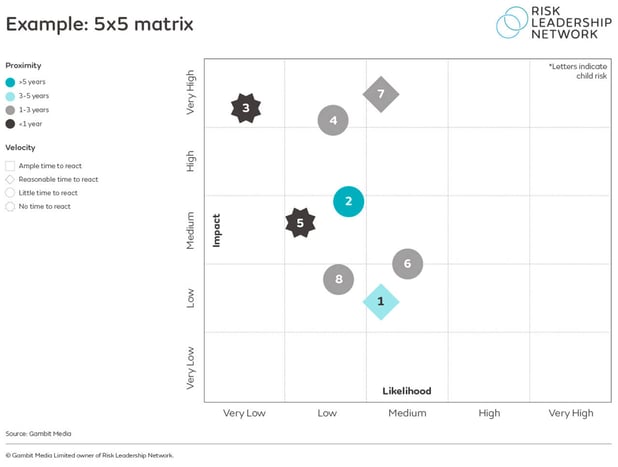
It is worth highlighting that several risk leaders across our network are adding the additional lenses of velocity and proximity to the popular likelihood-impact matrices used in board or audit & risk committee reporting. This is helping some businesses adjust their appetite for risks that are closer to impacting the business and/or changing more quickly.
Once an organisation has defined clear thresholds for the level of risk it is willing to accept in each of its principal / material risk areas, the next step is to reflect this in their key risk indicators. Below, we outline three key tips risk leaders have shared within the network for more effective indicators.
1. Place an emphasis on leading indicators
A typical suite of KRIs will usually consist of both leading and lagging indicators – while lagging indicators look back at whether an intended outcome was achieved, leading indicators provide a view on whether outcomes are likely to happen in the future.
While lagging indicators are, understandably, easier to define – if the outcome has already occurred, it is relatively simple at that point to measure it – an overreliance on lagging indicators may cause you to adopt a reactive approach to risk. This means that by the time you realise you are operating outside of risk appetite, it may already be too late to prevent threats to the business from materialising. Equally, opportunities to strategically take risk may be missed.
Alternatively, placing a greater amount of focus on leading indicators can give you the tools to be proactive and stay within risk appetite, as they will highlight when you are moving closer to your established thresholds for risk-taking before they are exceeded.
Here are four leading indicators that might be useful for your business, which we’ve collected from practising risk managers:
- Financial risk – Percentage of invoices paid on time
- Health and safety risk – Hazard report frequency rate
- Cyber risk – Percentage of IT managed servers with effective endpoint protection
- People and talent risk – Learning and development budget per employee
2. Use a dashboard to visualise the relationship between risk appetite and KRIs
When interacting with the board and executives on the topic of KRIs and risk appetite, it’s important to be able to demonstrate the relationship between them in a clear, concise manner. One way of tackling this challenge is to create a simple dashboard that highlights the relative location of your key risk indicators in comparison to your risk appetite settings.
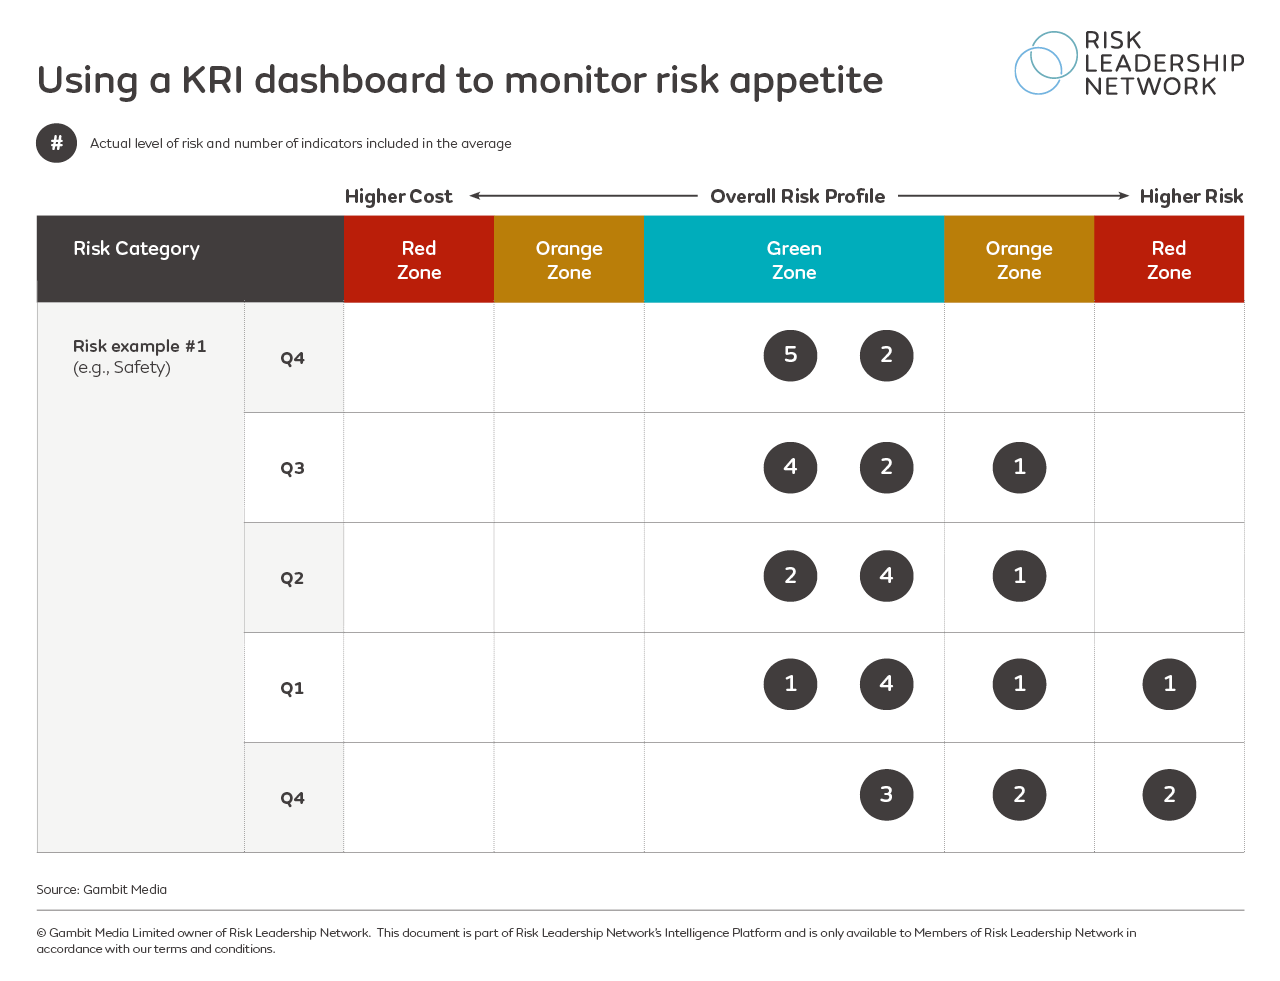
In the graphic above – a redacted template of the kind used by several risk leaders across the network – KRIs are plotted on an appetite chart according to how costly the risk will be to manage, and the impact the risk could have on the business. Plotting indicators on a graphic like this can help to focus discussions with senior leaders on the risks that are most relevant – for example, there is little point in focusing lots of time on those that sit in the green zone.
If an indicator is plotted in the orange zone, some risk leaders would argue it should only be there for a set amount of time (e.g. six months); if it remains there longer (or moves into red), that would suggest that the risk is changing, or that a review of how the business is managing this risk needs an urgent review.
3. Evolve your indicators to maintain their relevance and usefulness
KRIs should not be set in stone – as suggested above, if the nature of a risk your business faces is changing, then your KRIs should also be adapted to maintain their relevance and usefulness.
For example, on the topic of cyber risk, a series of increasingly sophisticated cyber-attacks may have been directed at numerous other companies in your sector via phishing emails – if the indicators you currently have in place do not focus enough (or at all) on this particular attack, you may need to review them to ensure the risks facing your organisation (e.g. a cyber-attack) do not exceed an acceptable limit.
Looking at KRIs from the other angle, there may be an opportunity for the business to enter a new market or take advantage of a technological innovation – this might require you to adjust your KRIs so that they are focused around taking enough risks to realise the opportunity that is on the table.
Share this

Four questions to ask when assessing your risk appetite statements

How to boost risk appetite awareness across the business